Google Search Console: A Beginner-Friendly Step-by-Step Tutorial
Google Search Console gives you a direct look at how Google sees your website. This free tool shows your search rankings, traffic data, and technical problems that hurt your visibility. Every website owner needs to master it.
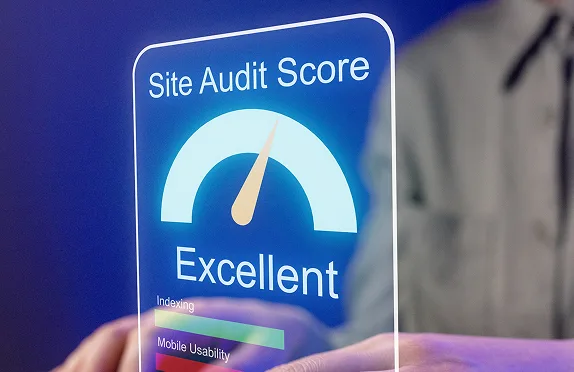
Agency Dashboard
February 06, 2026 · 14 min read
1KSHARES
7KREADS
Unlike paid SEO tools that estimate your performance, GSC provides exact data straight from Google itself. You see real clicks, actual impressions, and genuine ranking positions. This accuracy makes it essential for anyone serious about search engine optimization.
This tutorial walks you through every important feature. You'll learn what each tool does, how to use it, and why it matters to your website's success. Let's start with the basics.
How to Set Up Your Google Search Console Account
Before you access any data, you need to prove you own your website. Google site performance dashboard only shows information for sites you actually control.
Choose Your Verification Method:
Google offers two main property types. Domain properties track everything—all subdomains and both HTTP and HTTPS versions. URL prefix properties only track the exact URL you specify. Most people pick domain properties because they capture complete site data. You verify these by adding a DNS record through your domain registrar. The process takes about five minutes. URL prefix properties work differently. You can verify them by uploading an HTML file to your site, adding a meta tag to your homepage, or connecting to your existing Google Analytics account. These methods are simpler but less thorough.
Wait for Data Collection:
After verification, give Google 24-48 hours to collect data. The search console tools need time to process your site's information and generate your first SERP performance reports. Check back the next day to see your initial performance metrics.
Understanding the Overview Dashboard
The Overview page gives every SEO professional a snapshot of your website's search performance. You see four main sections here: Performance, Indexing, Experience, and Enhancements.
Performance Summary:
This section shows your total clicks and impressions from Google search over the past three months. A quick glance tells you if traffic is going up, staying flat, or dropping.
Indexing Status:
See how many of your pages Google has indexed. If this number seems low compared to your total pages, you've got indexing problems to investigate.
Experience Metrics:
Core Web Vitals scores appear here. These measure your site's loading speed and user experience. Poor scores hurt your rankings.
Enhancement Alerts:
Google flags any issues with structured data or rich results. Fix these to make your search listings stand out with extra features like star ratings or FAQs.
The Performance Report Explained
This report answers your most important question: how much Google traffic am I getting? It breaks down every click and impression your site receives from search.
Reading the Main Graph:
The graph shows daily traffic over your selected time. You'll see four key metrics you can toggle on and off.
Total Clicks:
How many people clicked through to your site from search results.
Total Impressions:
How often do your pages appear in search results, even if nobody clicked.
Average CTR:
Your click-through rate—clicks divided by impressions. Higher is better.
Average Position:
Where your pages rank on average across all queries. Lower numbers mean higher rankings.
Using Date Comparisons:
Compare this month to last month or this year to last year. Date comparisons reveal trends and help you measure the impact of your SEO Efforts. Seasonal businesses especially benefit from year-over-year data.
Filtering Your Data:
Click the filter button to narrow down the results. You can filter by specific pages, search queries, countries, or device types. These filters help you answer specific questions about your traffic.
Want to see only mobile traffic? Add a device filter. Curious about traffic from a specific blog section? Filter by page URL. Each filter gives you a focused view of particular traffic segments.
Exporting Performance Data:
Click the export icon to download your data as a spreadsheet. The interface limits you to 1,000 rows, but you need this data for deeper analysis and reporting. Export regularly to track long-term trends.
Checking Which Pages Google Has Indexed
The Pages report shows which URLs Google has added to its search index. Only indexed pages can appear in search results, making this report critical.
Understanding the Index Graph:
You'll see two main categories: pages indexed and pages not indexed. The "not indexed" number often looks scary, but don't panic yet. Many pages shouldn't be indexed. Duplicate content, redirected URLs, and intentionally blocked pages all count as "not indexed"—and that's fine.
Common Indexing Issues:
Scroll down to see why pages aren't indexed. According to Oncrawl, Google also determines crawl budget by “crawl demand.” Popular URLs have a higher crawl demand because Google wants to provide the freshest content to users.
Redirect:
The old URL redirects to a new one. Only the new URL gets indexed.
Duplicate:
Google found identical content elsewhere and chose one version to index.
Crawled but not indexed:
Google saw the page but decided not to include it. This often means quality issues.
404 errors:
The page doesn't exist. Fix broken links or remove these from your sitemap.
Fixing Index Problems:
Click on any issue to see affected URLs. Review each one and decide if it needs to be fixed. Request indexing for important pages that Google missed.
URL Inspection Tool: Your Debugging Friend
Do you need to check on a specific page? The URL Inspection tool gives you detailed information about any URL on your site.
Checking Index Status:
Type any URL from your website into the search bar at the top of Console Search. Hit enter and you'll see if Google has indexed that page. The tool shows when Google last crawled the page, whether it's indexed, and any problems encountered. This instant feedback helps diagnose why specific pages don't appear in search results.
Testing Live URLs:
Click "Test Live URL" to see how Google views your page right now. This differs from the cached version and shows recent changes immediately. Use this after fixing errors to confirm Google can now properly access and read your page. Testing takes about 30 seconds.
Requesting Indexing:
Just published new content? Don't wait for Google to discover it naturally. Click "Request Indexing" to fast-track the process. Google prioritizes these requests and typically crawls the page within a few days. Save this feature for important pages—don't spam requests for every minor update.
Monitoring Your Core Web Vitals Scores
Page speed affects rankings. Core Web Vitals measure three aspects of performance that Google uses in its ranking algorithm.
Largest Contentful Paint (LCP):
LCP measures loading speed. Your largest visible element should load within 2.5 seconds. Images, videos, and text blocks all count. Slow LCP frustrates visitors and hurts rankings. The report shows which pages load slowly so you can optimize images, reduce JavaScript, and improve server response times.
Interaction to Next Paint (INP):
INP tracks responsiveness. It measures how quickly your page responds when users click buttons or tap links. According to web.dev's performance guidelines, a good INP should be under 200 milliseconds. Poor INP creates a laggy feel. Users think your site is broken when buttons don't respond instantly. Optimize JavaScript and reduce complex layout calculations to improve this metric.
Cumulative Layout Shift (CLS):
CLS measures visual stability. Content shouldn't jump around as the page loads. Reserve space for images and ads so they don't push content down unexpectedly. Good CLS keeps layouts stable and prevents accidental clicks. Users hate when text moves just as they're about to click something.
Mobile vs Desktop Performance:
Google tracks these metrics separately for mobile and desktop devices. Mobile performance matters more because most searches happen on phones. Focus optimization efforts on mobile first. Desktop scores usually improve automatically when you fix mobile issues.
Managing Your Sitemap Submissions
Sitemaps help Google discover all your pages. The Sitemaps report shows if Google has processed yours correctly.
Submitting Your Sitemap:
Navigate to the Sitemaps section and enter your sitemap URL. Most sites use /sitemap.xml as the standard location. Click submit and Google begins processing it.
Checking Processing Status:
The report shows whether Google successfully read your sitemap. Errors indicate problems with XML formatting or file accessibility. Common errors include exceeding size limits (50MB uncompressed or 50,000 URLs), broken XML syntax, or server blocks preventing access.
Tracking Discovered URLs:
Google reports how many URLs it found in your sitemap and how many it indexed. Large gaps between discovered and indexed pages suggest quality issues or crawl budget problems. If Google discovers 1,000 pages but only indexes 200, you need to investigate why 800 pages got rejected.
Updating Your Sitemap:
Dynamic sitemaps update automatically when you publish new content. Static sitemaps need manual updates and resubmissions. Resubmit updated sitemaps through web console google so Google knows to recrawl changed pages.
Analyzing Your Backlink Profile
Backlinks remain crucial for rankings. The Links report shows which sites link to yours and which pages attract the most links.
Top Linking Sites:
This section lists domains pointing to your website. High-quality links from relevant sites boost authority and rankings. Review this list regularly to spot new backlinks. You can also identify potentially harmful links from spammy sites.
Most Linked Pages:
Some pages naturally attract more links than others. Identify your link magnets and create similar content. If your best-performing blog post has 50 backlinks while your product pages have zero, that tells you something about your content strategy.
Internal Links Report:
Internal linking helps Google understand site structure. The report shows which pages receive the most internal links from other pages on your site. Make sure your most important pages get strong internal link support. This signals their importance to Google.
Exporting Link Data:
The interface doesn't show specific URLs providing backlinks. But you can export the full dataset as a spreadsheet to see exact linking pages.
Fixing Indexing Errors with Validation
When you fix technical problems, tell Google to check your work. The validation process confirms your fixes worked.
Starting Validation:
Click on any issue in the Pages report to see affected URLs. After fixing the problem on your site, click "Validate Fix" to start the process.
How Validation Works:
Google recrawls the affected URLs to verify the issue is resolved. This takes anywhere from a few days to several weeks depending on your site's crawl rate. You'll receive email updates as validation progresses. Check the report to see which URLs passed and which still have problems.
Understanding Validation Status: Started: Google began checking your fixes but hasn't finished yet.
Passed: The issue is fixed, and Google confirmed it.
Failed: The problem still exists. Review and fix it again.
Don't worry if validation takes weeks. Large sites with thousands of pages naturally take longer to fully validate.
Discovering Your Top Search Queries
The Queries tab in Performance shows which keywords bring traffic to your site. This data is gold for Digital Marketer professionals planning content.
Finding Quick Wins:
Sort by average position to find keywords where you rank between positions 4-10. These represent quick win opportunities. Small optimizations often push these keywords into the top three positions, dramatically increasing clicks. Prioritize improving content for these queries.
Identifying Content Gaps:
Look for high-impression, low-click queries. These keywords show your page often, but few people click through. This signals weak titles and meta descriptions. Rewrite them to improve click-through rates without changing rankings.
Tracking Keyword Performance:
Click any query to see its performance over time. The graph updates to show just that keyword's clicks, impressions, and position history. This helps you measure SEO Campaigns targeting specific keywords. You can prove which optimization efforts actually moved the needle.
Setting Up Automated Reporting
Manually checking Google Search Console tools every day wastes time. Smart agencies automate their reporting process.
Using a GSC Reporting Tool:
Tools like Agency Dashboard pull data from Google Search Console automatically. Connect once and forget about manual exports. These platforms generate Google Search Console Reports on schedule—weekly, monthly, or whatever cadence your clients prefer. You spend minutes reviewing instead of hours compiling data.
Building Report Templates:
Create standardized reports highlighting metrics clients care about. Include clicks, impressions, top keywords, and ranking changes. Template-based reporting ensures consistency across all client accounts. New clients get the same professional experience as long-term accounts.
White-Label Client Reporting:
The best tools offer White-Label Client Reporting with your agency's branding. Clients see your logo, colors, and domain—not the tool provider's identity. This professional presentation reinforces your agency's expertise. Clients never know you're using third-party software.
Scheduling Automatic Delivery:
Set reports to send automatically every Monday morning or the first day of each month. Clients receive their performance updates on schedule without you remembering to send them. Consistency builds trust and keeps clients engaged with their SEO roadmap progress.
Tracking Your SEO Campaign Results
Use Search Console to measure the impact of your optimization work. Data proves which efforts actually improve results.
Setting Benchmark Dates:
Before starting any SEO Campaigns, note your current performance metrics. Record total clicks, impressions, and average position. Mark the date you implement changes. This becomes your "before and after" dividing line.
Measuring Campaign Impact:
After 30-60 days, compare current performance to your benchmark. Look for improvements in clicks and rankings for targeted keywords. Not every campaign succeeds. Google search traffic data sometimes shows that changes had no impact or even hurt performance. Learn from failures and adjust your strategy.
Documenting Success:
When campaigns work, document the results. Note which changes you made, when you made them, and the measured improvement. This documentation proves ROI to stakeholders and guides future optimization decisions. Success patterns emerge over time.
Every Click Tells a Story, Start Reading Yours
Google Search Console provides everything you need to understand how Google sees your website. The data is free, accurate, and essential for anyone serious about search visibility.
Set aside time this week to explore each report. Check your indexing status, review your top queries, and fix any technical errors. These small actions compound over time into significant traffic growth.
Master these google search console seo tools with Agency Dashboard and you'll make smarter decisions about your SEO strategy. Every click, impression, and ranking position tells a story. Learn to read that story and you'll know exactly how to get views with google search console.
Frequently Asked Questions
Google Search Console shows how your website performs in Google search results. It tracks rankings, identifies technical errors, and measures traffic to help you improve SEO performance.
Many pages shouldn't be indexed, like duplicates, redirects, or intentionally blocked URLs. Review each indexing issue to determine if action is needed.
No, you can only see data for websites you own and verify. Console Search only provides information for your own properties.
Clicks count how many people visited your site from search. Impressions count how often your pages appeared in results, whether clicked or not.
Use Google Search Console to find pages with high impressions but low clicks, then optimize their titles, meta descriptions, and content. Fix indexing errors, improve pages ranking on page two, and expand content around top-performing queries.
Delete Projects/Keywords to downgrade your subscription.
Are you sure, you want to downgrade?
Start For Free
Verify Your Email
All-In-One Reporting Platform for Agencies
Welcome Back ! Please Login to your account to continue
All-In-One Reporting Platform for Agencies
Please enter your email address below
Agency Dashboard uses cookies and similar technologies to ensure website security, functionality, performance analysis, and service improvement. Essential cookies are required for the operation of the website and cannot be disabled. Non-essential cookies are used only with your explicit consent, in accordance with GDPR and applicable data protection laws. We are committed to safeguarding personal data, including PII and, where applicable, ePHI, in alignment with ISO 27001 and SOC 2 Type II standards. Your consent is securely recorded for audit purposes, and you may modify or withdraw your preferences at any time via Cookie Settings or our Privacy Policy.