Facebook Ads Reporting Tool for Agencies
Agency Dashboard provides a dedicated Facebook ads reporting tool built specifically for agencies, helping you analyze spend, measure performance, and create client-ready reports in minutes.
No more spreadsheets, screenshots, or switching between multiple Facebook ads tools.
Get Started - it's free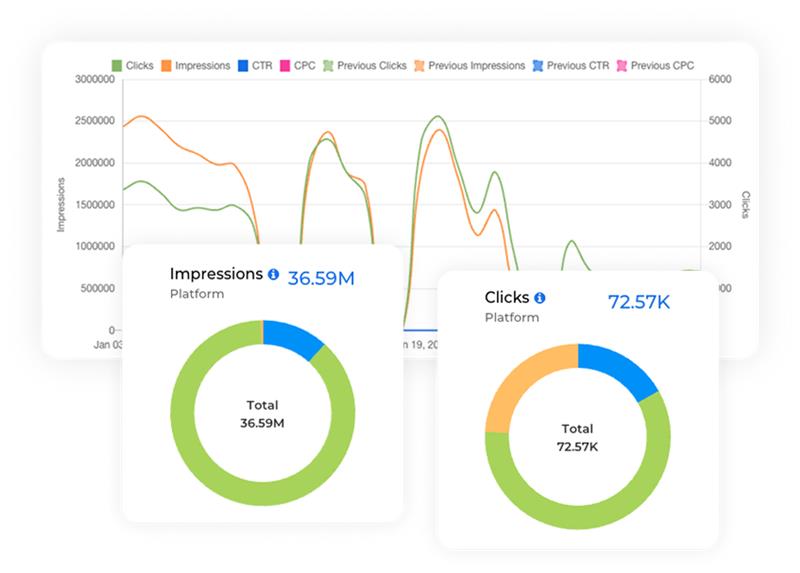

Unified Facebook Ads Reporting
Analyze campaigns, ad sets and ads in one streamlined dashboard.

Client-Ready White-Label Reports
Export branded Facebook ad reports without manual leg work.

Automated Performance Reporting
Schedule weekly or monthly delivery with zero manual work.

Deep Audience & Placement Insights
Understand performance by demographics, devices and placements instantly.
Facebook Ads Reporting for Agencies
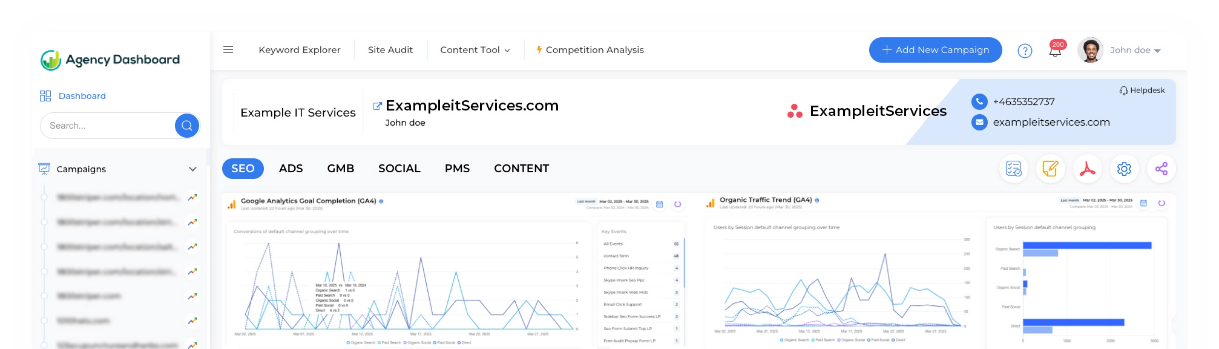
Agency Dashboard gives agencies a clean, powerful Facebook ads reporting tool designed to simplify campaign analysis without navigating Ads Manager.
View spends, conversions, ROAS, impressions and engagement metrics in one place — all presented clearly for fast decision-making and client reporting.
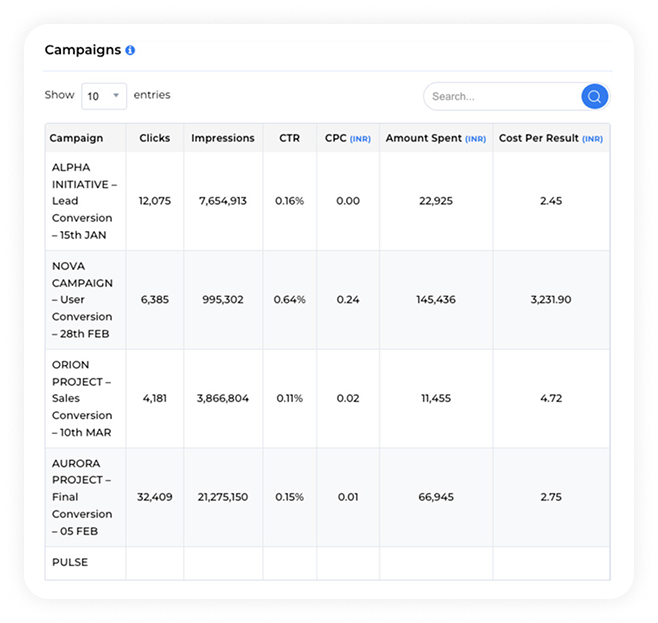
Campaign Performance Command Center
Track every campaign from a single performance hub that highlights the metrics agencies care about most. This provides a structured overview of clicks, impressions, CTR, CPC, total ad spend, and cost per result, allowing teams to quickly evaluate efficiency and campaign impact.
With clear visibility into engagement and spending patterns, agencies can identify winning campaigns, control budgets, and optimize results without navigating complex dashboards. The streamlined campaign view turns raw data into actionable insight, helping teams move faster and make smarter decisions for every client.
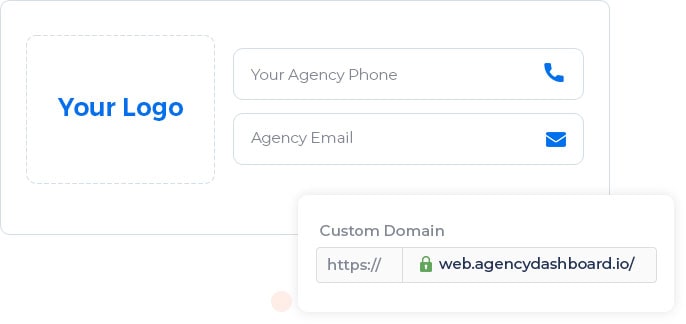
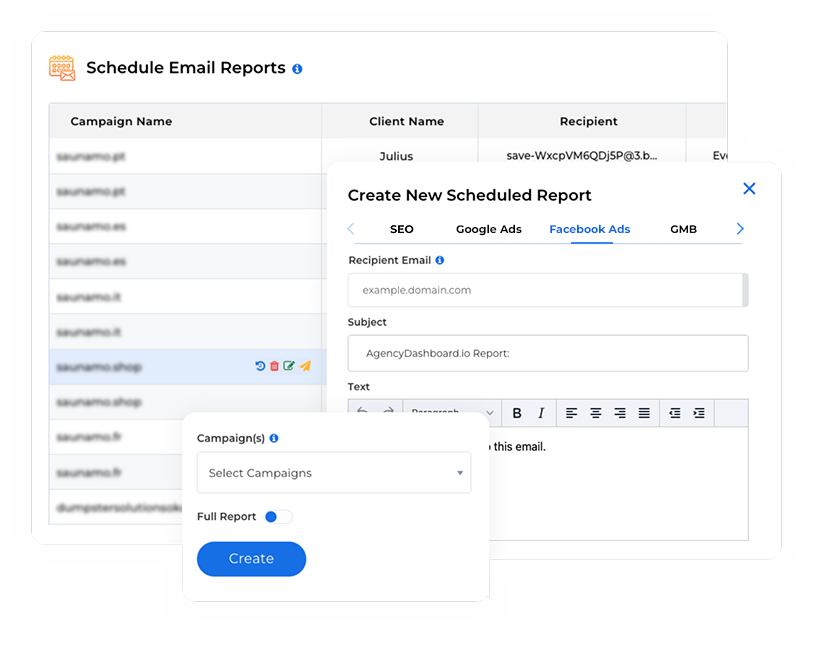
White-Label Facebook Ads Reports
Agencies can create professional, branded facebook ad reports for clients with their logo, color palette and domain.
These white-label presentations eliminate the need for spreadsheets or designing slides manually, making this one of the best facebook ads reporting tools available for client-facing reporting.
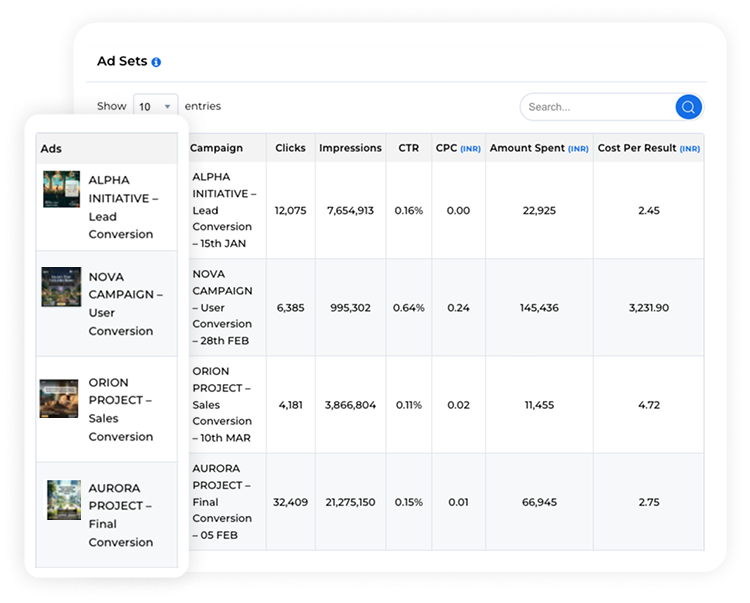
Ad Set & Ad-Level Breakdown
See exactly how each ad set and individual ad performs through detailed views showing clicks, conversions, CTR, CPA and ROAS. This structured layout makes the platform a reliable facebook ads analysis tool for identifying strengths, weakness and optimization priorities. This deeper visibility makes it easier to compare creative variations, audience segments, and bidding strategies side by side.
With granular performance insights, teams can quickly spot underperforming ads, double down on top performers, and prioritize optimizations that have the biggest revenue impact. The organized breakdown eliminates guesswork and turns campaign data into a practical decision-making tool. As a result, agencies can move from reactive reporting to proactive optimization, using real performance signals to continuously improve efficiency, scale winning ads, and deliver stronger ROI for clients.
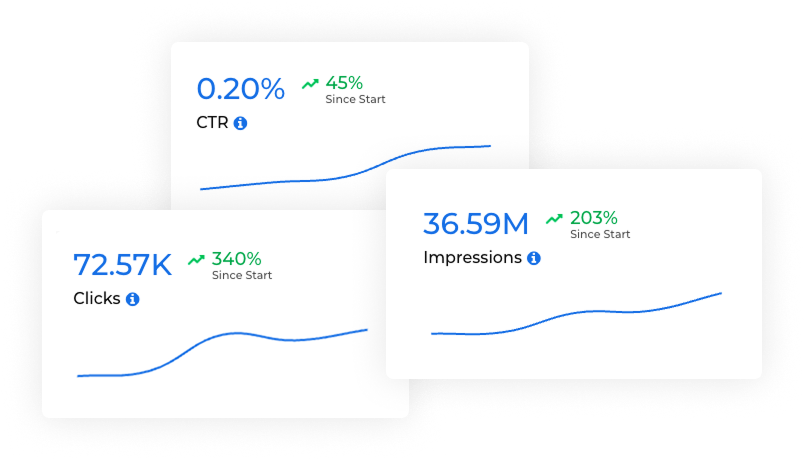
Performance Summary Graph
Visualize campaign momentum through a clear performance summary graph that compares current results against previous periods. This highlights key metrics — clicks, impressions, CTR, and CPC — alongside their historical counterparts, making trends instantly recognizable. Agencies can quickly see whether engagement is rising, costs are improving, or performance needs attention, without digging into spreadsheets or manual comparisons.
By presenting current and previous clicks, impressions, CTR, and CPC in one visual snapshot, the graph transforms raw numbers into an easy-to-understand story. Teams can spot growth patterns, detect performance drops early, and confidently communicate progress to clients. This side-by-side comparison helps agencies make faster optimization decisions while reinforcing transparency and accountability in reporting.
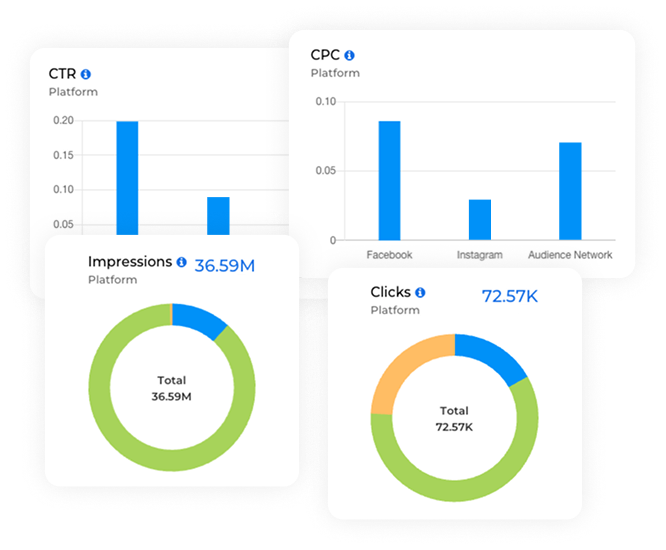
Click & Impression Performance by Platform
Understand how engagement is distributed across platforms with a focused breakdown of total clicks and impressions. This provides a clear summary of performance by platform, helping agencies identify where audiences are most active and which channels are driving the strongest visibility. By viewing total clicks alongside total impressions in a structured format, teams can quickly evaluate reach, engagement quality, and platform efficiency.
This platform-level perspective makes it easier to adjust budget allocation, refine targeting strategies, and prioritize the channels delivering the highest impact. With a simplified overview of total performance, agencies gain actionable clarity that supports smarter cross-platform decisions and more effective campaign scaling.
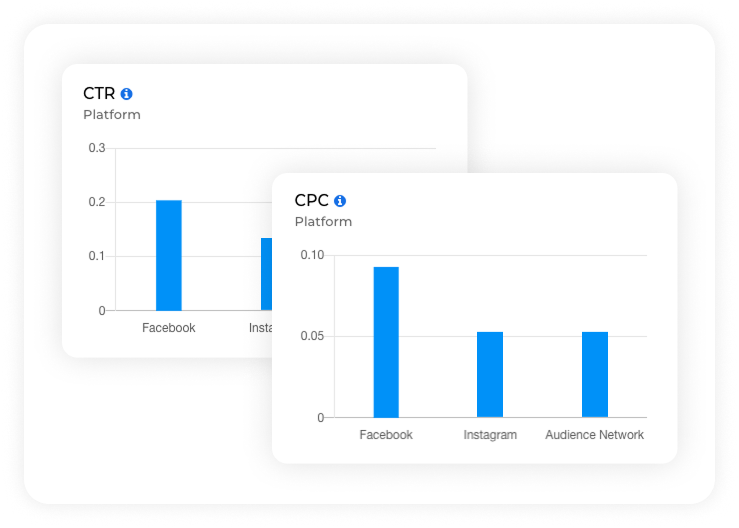
Platform CTR & CPC Graph
Compare engagement efficiency across platforms through a visual graph that presents CTR and CPC side by side. This helps agencies quickly understand how each platform performs in terms of attention and cost, turning complex performance data into an easy-to-read comparison. By mapping click-through rates and cost per click visually, teams can spot which platforms deliver strong engagement at efficient costs and which may require optimization.
The structured graph view simplifies cross-platform decision-making by highlighting performance gaps and opportunities at a glance. Agencies can use these insights to rebalance budgets, refine targeting, and scale high-performing channels with confidence, ensuring campaigns remain both competitive and cost-effective.
Custom Conversion & Event Tracking Overview
Visualize custom conversions and tracked events through a dedicated performance graph designed for deeper campaign insight. This section highlights how users interact with ads beyond clicks, showing meaningful actions such as purchases, sign-ups, and other defined conversion events. By mapping these behaviors visually, agencies gain a clearer understanding of how campaigns contribute to real business outcomes.
The event-focused graph transforms conversion tracking into an easy performance narrative. Teams can quickly measure growth trends, compare event activity over time, and identify which campaigns drive the highest-value actions. With custom conversion visibility built into reporting, agencies move beyond surface metrics and focus on the outcomes that directly impact client revenue and success.
White Label Reporting Tool Trusted by 1000+ Digital Marketers
Start Your Free Trial Today!Why Agencies Should Use a Facebook Ads Reporting Tool

Reporting Shouldn’t Take Hours
Manually creating reports for each client wastes valuable time. With an automated Facebook ads reporting tool, agencies can generate accurate insights quickly and focus more on strategy and campaign optimization.

Clients Need Clear Performance Reports
Clients don’t understand complex dashboards. Structured Facebook ad performance reports make results easy to explain, helping agencies build trust and justify ad spend during meetings or performance reviews.

Better Campaign Insights = Better ROI
Data alone doesn’t improve campaigns, insights do. Using advanced Facebook ads analysis tools, agencies can find wasted spend, detect strong ad variations, and make smarter decisions that directly improve ROI.

Manage Multiple Accounts with Ease
Handling several client accounts manually is inefficient. A dedicated Facebook ads management tool centralizes data, improves tracking, and makes it simpler to manage all campaigns inside one organized dashboard.

Professional White-Label Reports for Clients
Agencies need branded and client-ready reports. With automated Facebook ad reports for clients, you can export or schedule professional reports using logo, brand colors, etc.

Data That Supports Agency Growth
Scaling an agency requires proven results and clear communication. The best tool for Facebook ads reporting helps agencies improve transparency, retention, and decision-making, all through data-driven insights.
More Integrations for Agency Dashboard


Sign Up for Free
Start your effortless marketing journey with Agency
Dashboard with a 14-day free trial today!