- Blog
- /
- SEO Reporting
- /
- SEO Dashboard for Clients
What Makes a Great SEO Dashboard? Key Metrics and Visuals to Include
Most client dashboards show too much data and too little insight. Here is what a great SEO dashboard includes and how to build one clients actually use.
Agency Dashboard Team
May 15, 2026 · 11 min read- 3.5KSHARES
- 26KREADS
Most agencies build dashboards around what is easy to export, not around what clients need to understand. The result is a view packed with 30 data points that creates the impression of thorough reporting while actually communicating nothing decisive. A client who stares at a wall of metrics for forty seconds and closes the tab has not been informed. They have been overwhelmed.
Client SEO dashboards that work, that clients open, reference in renewal conversations, and share with their leadership teams, are built around a different principle: show fewer numbers, but make each one mean something specific to that client's business.
This blog post covers what how to build SEO dashboard for clients correctly requires, which metrics belong in every dashboard and which belong in internal reporting only, how trending keyword data transforms retrospective dashboards into forward-looking strategy tools, and what the visual and organizational decisions look like in practice.
Why Most Client Dashboards Fail Before Anyone Reads Them
The failure mode is predictable. An agency connects a reporting platform to Google Analytics, Google Search Console, and a rank tracker. The platform generates a default dashboard template showing every available metric: sessions, users, pageviews, session duration, pages per session, bounce rate, new vs. returning visitors, keyword positions, impression share, average position, click-through rate, crawl errors, domain authority, referring domains, and forty more fields depending on how many integrations are connected.
The account manager sends this to the client. The client scrolls through it looking for the answer to one question: "Is this working?" The dashboard does not answer that question. It provides the raw materials from which an expert could eventually construct an answer. That is not the same thing.
SEO client communication breaks down at exactly this point, when the agency treats reporting as data delivery rather than insight delivery. The data is the raw material. The dashboard is where that data gets organized into a narrative the client can follow without a technical background.
Clients who receive consistent, clear performance reporting are 2.7x more likely to renew their contracts than those who receive inconsistent or hard-to-interpret reporting. The dashboard is not a reporting afterthought. It is one of the primary mechanisms through which the agency's value is communicated and retained.
The Role of White-Label SEO Reports in Client Trust
White-label SEO reports are the client-facing output of the dashboard, the structured document that arrives in the client's inbox on the first of every month and tells the story of what happened, what it means, and what comes next.
The white-label distinction matters more than agencies often acknowledge. A report that arrives with a third-party platform's logo in the header tells the client two things: the agency uses external tools, which is fine and expected, and the agency has not taken the step of presenting that work as their own professional product. The latter impression, subtle as it is, affects how the client perceives the value of the relationship.
SEO reporting platforms that support full white-labeling, agency logo, agency color scheme, agency domain, no mention of the underlying tool, present the agency as an integrated service provider rather than a reseller of software access. Agency Dashboard's white-label reporting system does this at every plan tier from Freelancer upward, with no additional branding configuration cost.
The report and the live dashboard serve different but complementary functions. The live client SEO dashboards give clients a self-service view for the moments between monthly reports when they want to check specific metrics. The monthly report gives them a structured narrative they can share with leadership, reference in budget conversations, and use to evaluate agency performance at renewal.
Both need to carry the agency's brand. Both need to be readable by a non-technical executive. And both need to be connected to the same underlying data so the numbers in the report match what the client sees when they log into the dashboard.
What to Include in an SEO Dashboard
An SEO dashboard is determined by one question: what does this specific client need to see to know whether their investment is producing the intended result? The answer is different for a local services business measuring phone call volume, an e-commerce brand measuring revenue per organic visitor, and a B2B SaaS company measuring demo request rate from organic traffic. The metrics are the same category, but the targets, benchmarks, and context are client-specific.
That said, there is a set of core data categories that belong in every client SEO dashboards build regardless of industry or business model. Here is what each one shows and why it belongs:
How to Find Trending Keywords and Include Them in Client Dashboards
Trending Keywords in the dashboard context means two distinct things: keywords the client already tracks that are gaining position momentum, and keywords not yet being targeted that are showing rising search volume in the client's topic area. Both belong in the dashboard. Neither appears automatically without intentional data sourcing and configuration.
How to Find Trending Keywords for Client Campaigns
Finding Trending Keywords for an existing client campaign starts with two data sources that every agency already has access to.
The first is Google Keyword Trends, specifically Google Trends data showing whether search volume for the client's core topic areas is rising, seasonal, or declining. This data provides macro-level validation for keyword investment decisions: targeting a term in a declining trend category requires a different strategy than targeting one in a growing category. Agency Dashboard's keyword research tool connects position data to trend signals so this context appears alongside rank tracking rather than requiring a separate lookup.
The second is the Google Search Console Performance report, specifically the "Queries" view filtered to show impressions growth over the past 90 days for queries the site is not yet ranking well for. These are the Trending SEO Keywords within the client's actual organic footprint: terms the audience is already searching that the site is beginning to show up for but has not yet optimized toward. These represent the fastest content opportunities available. The keyword research has effectively been done by the audience, and the data is sitting in GSC waiting to be acted on.
A dedicated section in the dashboard that surfaces these opportunities, "Rising Queries in Google Search Console", turns the dashboard from a retrospective performance review into a forward-looking content planning tool. Account managers who can point to three specific terms in a monthly review call and say "these are the queries your audience is searching more often this month, and here is the content we are producing to capture them" are delivering strategic value that clients cannot get from the data alone.
Google Keyword Trends data should appear in the dashboard as context, not as a primary KPI. Trend direction informs strategy. Position and traffic data measure outcomes. Both belong in the same view, but in separate sections that serve their respective functions.
Building a Customizable SEO Dashboard That Scales
Customizable SEO dashboard capability is what allows a single reporting platform to serve the full range of client types an agency manages from a local plumber whose primary metric is Google Maps ranking and call volume, to a B2B SaaS company whose primary metric is organic demo request rate, to an e-commerce brand whose primary metric is revenue per organic session.
The same underlying data sources, rank tracker, Google Search Console, Google Analytics, site audit, produce the raw material for all three. The customization layer determines which data is surfaced, in which order, with which visualization format, and against which client-specific target or benchmark.
Client Dashboard for SEO configuration that scales across an agency's client roster requires template-based customization: a defined structure per client type (local, e-commerce, B2B, content publisher) that can be applied and then refined per client, rather than building each dashboard from scratch. This approach maintains quality consistency across accounts while accommodating the specific data priorities of each client.
The KPI Experience Client should feel like the dashboard was built specifically for their business, not like a default reporting template with their logo placed in the corner. This distinction is what clients feel, even if they cannot articulate it technically. A dashboard that shows "demo requests from organic" as the top-line metric for a SaaS client communicates that the agency understands the business. A dashboard that shows total pageviews at the top communicates that the agency populated a template.
How Agency Dashboard Brings It Together?
Agency Dashboard's client SEO dashboards connect Google Analytics 4, Google Search Console, rank tracking, site audit health scores, backlink monitoring, and AI Overview citation data into one unified client-facing view, branded entirely under the agency's name and delivered automatically on a monthly schedule.
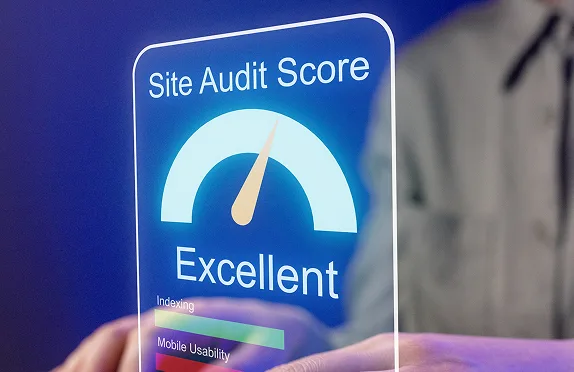
The rank tracker monitors keyword positions daily across desktop and mobile, feeding position trend data into the dashboard automatically without manual export. The website audit tool generates a site health score monthly that trends over time in the dashboard as a visible maintenance metric. The AI Overview tracking monitors AI citation frequency alongside traditional rank positions for every tracked keyword.
The white-label reporting system then takes all of this data and generates a branded monthly report delivered automatically to each client, with the agency's logo, the agency's color scheme, and the agency's domain visible at every touchpoint. No mention of Agency Dashboard reaches the client.
See all plans from $35/month with a 14-day free trial and no credit card required.
Frequently Asked Questions
A client SEO dashboard should include keyword ranking trends, organic traffic volume, bounce rate by landing page, backlink growth, Google Search Console metrics including impressions and click-through rate, site health score from audit data, and conversion rate from organic traffic. The data should be organized around the client's specific business goals rather than showing every available metric. Non-technical clients need business-outcome metrics front and center — ranking position and traffic trend together, connected to lead or revenue data where tracking allows.
Use a platform that connects directly to Google Analytics 4 and Google Search Console via API, pulls rank tracking data automatically, and presents it in a pre-built dashboard template. Agency Dashboard connects all of these data sources automatically and provides customizable dashboard layouts that can be branded with the agency's logo and colors. The initial setup per client takes under 30 minutes no developer involvement, no manual data exports, no formatting work.
These reports are client-facing documents that carry the agency's own branding logo, color scheme, and domain with no mention of the underlying reporting platform. Standard reports typically include the platform's branding, which undermines the agency's professional positioning. For client-facing delivery, white-label reports are the professional standard. Agency Dashboard produces fully branded reports at every plan tier from Freelancer upward, with scheduled automated delivery under the agency's name.
Client SEO dashboards should display live data that updates automatically — keyword positions daily, traffic data in near-real-time via Google Analytics integration, and site health scores updated monthly after each scheduled audit. Monthly formal reports should be sent regardless of whether the client actively checks the dashboard. The combination of a live dashboard for clients who want to self-serve between reports and a scheduled monthly report for those who prefer structured communication covers both preference types without additional manual work.
The most important client KPIs in an SEO dashboard are: average keyword ranking position trend over 30, 60, and 90 days; organic traffic volume segmented by landing page; organic click-through rate from Google Search Console; site health score from audit data; backlink domain growth; and conversion rate from organic traffic. Limit the executive summary to five to seven KPIs — more than that and the key signals get buried in the volume of data.
The Keywords should appear as a dedicated section showing which tracked keywords gained the most position improvement in the period, which newly discovered queries are generating growing impressions in Google Search Console, and which competitor terms are showing rising volume the client has not yet targeted. This section turns the dashboard from a retrospective performance review into a forward-looking opportunity indicator.
Yes — the best SEO reporting platforms connect Google Search Console directly via API alongside a dedicated rank tracker. Google Search Console metrics provide impression, click, and average position data for up to 1,000 top queries from Google's own systems. A rank tracker provides daily position monitoring for a defined keyword set. Together they give a more complete picture than either source provides alone — GSC for broad query discovery, the rank tracker for precise keyword-level position monitoring.

Table of Contents
Recent Posts

Uptime Monitoring: Why Every Agency and Business Needs It in 2026
How to Write SEO Blog Posts That Rank and Boost Organic Rankings
SEO Content Grader: How to Score Content Before It Goes Live